Oil and natural gas: Oil trying to hold above $77.50
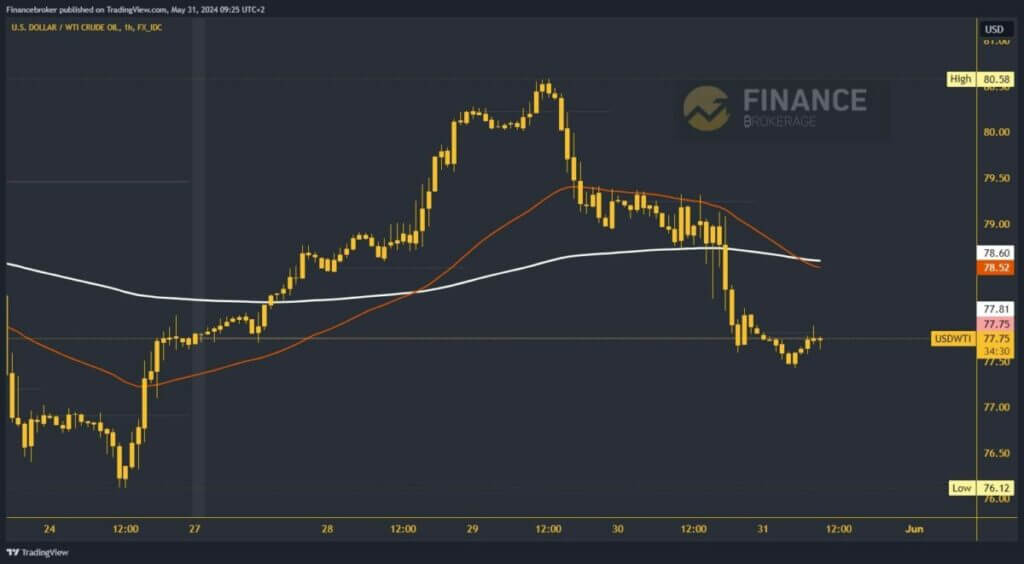
- During this morning’s Asian trading session, the oil price fell to $77.43.
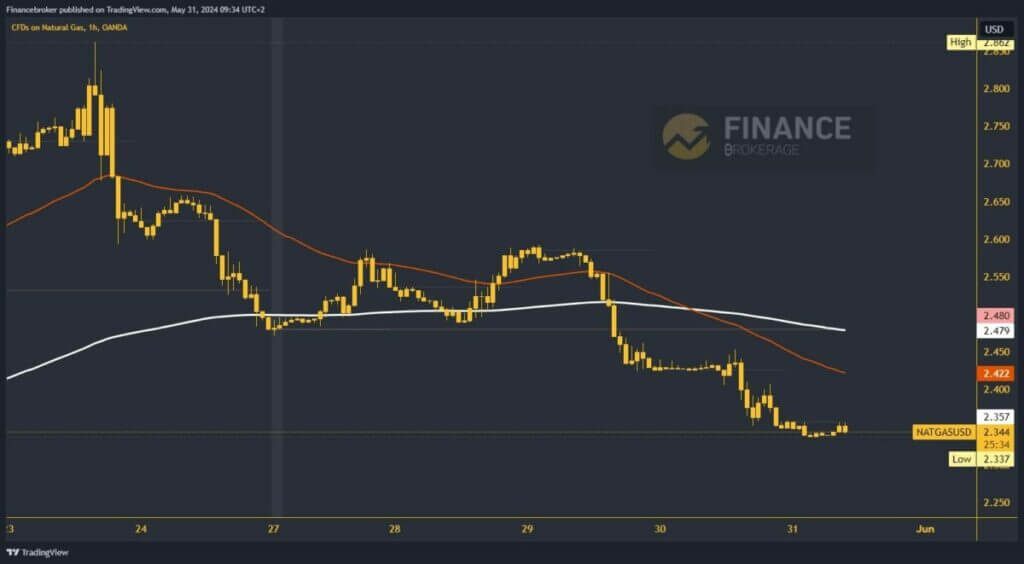
- During this morning’s Asian trading session, the price of natural gas fell to the $2.33 level, forming a new weekly low there.
Oil chart analysis
During this morning’s Asian trading session, the oil price fell to $77.43. With that drop, we formed a new weekly low. For now, the price manages to stabilize there and recover slightly to the $77.75 level. We need a stronger impulse to move us above $78.00 to initiate a more concrete recovery. Potential higher targets are $78.50 and $79.00 levels.
Additional resistance to oil prices in the $78.50 zone is the EMA200 moving average. We would gain stronger bullish momentum by breaking through that resistance as well. We need a negative consolidation and a descent to a new low for a bearish option. We are again retreating below the weekly open price and returning to the negative side. Potential lower targets are $77.00 and $76.50 levels.

Natural gas chart analysis
During this morning’s Asian trading session, the price of natural gas fell to the $2.33 level, forming a new weekly low there. In the EU session, we are still in the support zone and remain under pressure to fall to a new lower low. Potential lower targets are $2.30 and $2.25 levels.
For a bullish option, it is necessary first that the price of natural gas returns above the daily open price and the $2.35 level. Then, we have to hold ourselves there and stabilize before we go into further recovery. A new impulse would initiate a bullish consolidation. Potential higher targets are $2.40 and $2.45 levels. The first major resistance is in the EMA50 moving average in the $2.42 zone, then the EMA200 in the $2.48 zone.


