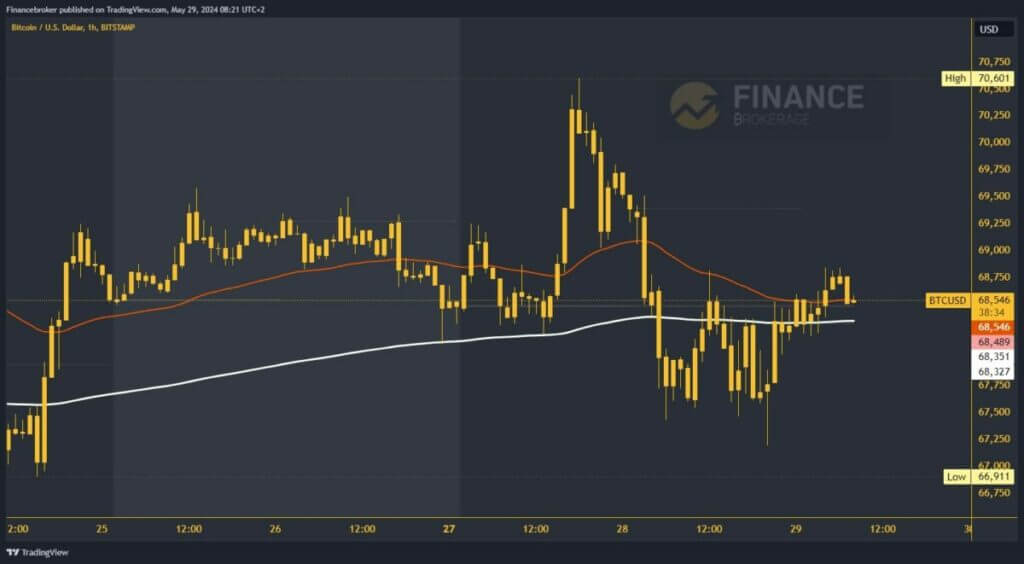
The price of Bitcoin crashed yesterday to the $67,200 level
- After the price of Bitcoin returned above the EMA200 moving average and $69000, expectations were that we were entering a bullish trend period.
Bitcoin chart analysis
After the price of Bitcoin returned above the EMA200 moving average and $69000, expectations were that we were entering a bullish trend period. That pushed the price to $70,601 on Monday. We couldn’t go any further and a bearish consolidation was started, and the price crashed down to the $67450 level. On Tuesday, Bitcoin spent moving in the $67400-$68600 range.
Today, Bitcoin demonstrated resilience by stabilizing above the EMA200 moving average and maintaining support in this zone. The weekly open price also plays a crucial role in this context, and our ability to stay above it is key to maintaining a positive outlook. If we manage to do so, we can anticipate further growth and a potential recovery above the $69,000 level.

Bitcoin could continue its recovery if it moves above $69,000
Potential higher targets are $69250 and $69500 levels. For a bearish option, the price of Bitcoin would have to go down to the $68,000 level. With that step, it descends to a new daily low and switches to the bearish side. After that, we expect increasing pressure on the price to start a pullback and search for new support. We are seeking the first support in yesterday’s zone around $67500.
New pressure there would only increase the instability on the chart, and with the bearish impulse the price would fall to a new lower low. Potential lower targets are $67250 and $67000 levels. Last week’s lowest Bitcoin price was at the $66075 level.


