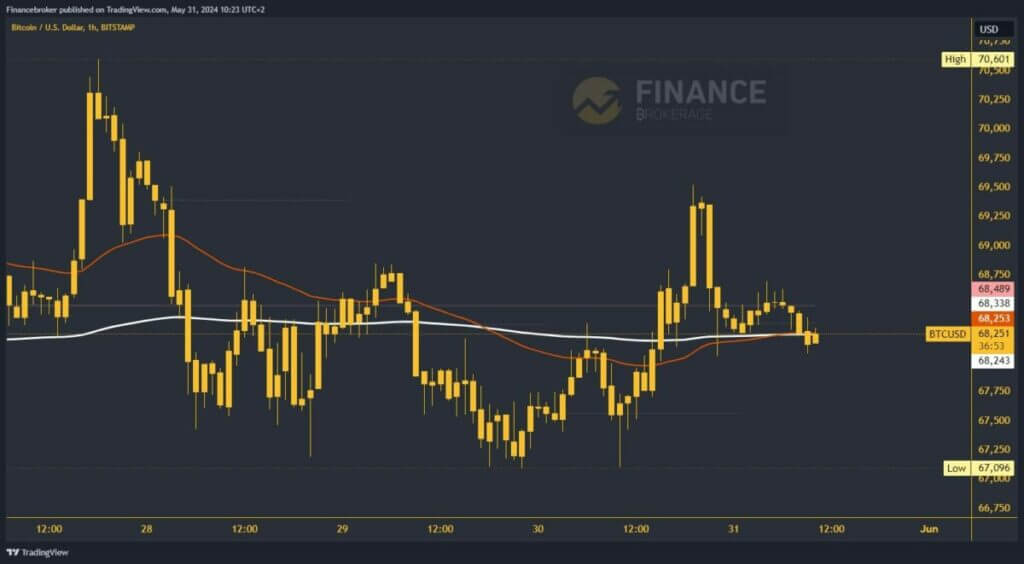
The price of Bitcoin rose to the $69,500 level yesterday
- Yesterday’s bullish consolidation pushed the price of Bitcoin up to the $69500 level.
Bitcoin chart analysis
Yesterday’s bullish consolidation propelled the price of Bitcoin to the significant $69500 level. However, we encountered a halt, and the price started losing momentum, triggering a bearish consolidation. We breached the crucial $68000 support level, testing the EMA200 moving average. This morning, we witnessed an effort to initiate a bullish consolidation, but we faced resistance at the key $68750 level.
From that level, we turn again to the bearish side, drop below the EMA200 and test the $68,000 level of support. Additional pressure is created by the fact that we are below the weekly open price, bringing instability to the chart.

Does Bitcoin have the strength to hold above $68000 and EMA200?
We require a fresh downward impulse and a breach below the $68000 level for a bearish scenario. This will lead to the formation of a daily low, confirming the bearish momentum. Potential lower targets are the significant $67750 and $67500 levels, bringing the Bitcoin price back to the weekly support zone around $67,000.
We need a positive consolidation and a breakthrough above the challenging $68750 level for a bullish scenario. This will mark a significant resistance level. With the upward momentum, we will establish a new daily high, initiating a further recovery to the bullish side. Potential higher targets are the promising $69,000 and $69,500 levels. If the growth persists above these levels, we could potentially test the optimistic $70,000 level.


